Geopoint
Cloud Native Bathymetric Data Processing
Working with Geopoint reduces the need for costly in-house computing infrastructure. It offers a scalable cloud-based service optimized for fast and reliable processing. Simply upload the survey files and sound velocity profiles, configure the vessel and start processing. Tools like tide correction and zoning are also there if needed.
In a test study the Geopoint output was compared to the official NOAA source data with a result of +0.05m mean difference in depth over an area of approximately 6 km2. This indicates the Geopoint System is consistent with established methods of hydrographic data processing.
Geopoint requires only a few basic cloud services to operate. The architecture utilizes functions on demand, minimizing computational overhead. The user interface requires a more robust resource especially when file sizes reach >500MB. Cloud storage is also a requirement, but the costs are usually quite low.
Geopoint was developed and tested over many years and provides a cloud native environment for processing HSX data files into fully corrected xyz data sets. Scientists, researchers, hydrographers and other professionals who collect and provide ocean mapping data can utilize Geopoint to provide reliable, accurate and fast results. Once uploaded, the data is accessible in the cloud and can be shared directly via URL.
Geopoint uses cloud micro services for the computationally intense task of combining the survey data streams and generating a georeferenced xyz data set. This is the unique advantage of a cloud native architecture. Learn more about our process design in the publications link above.
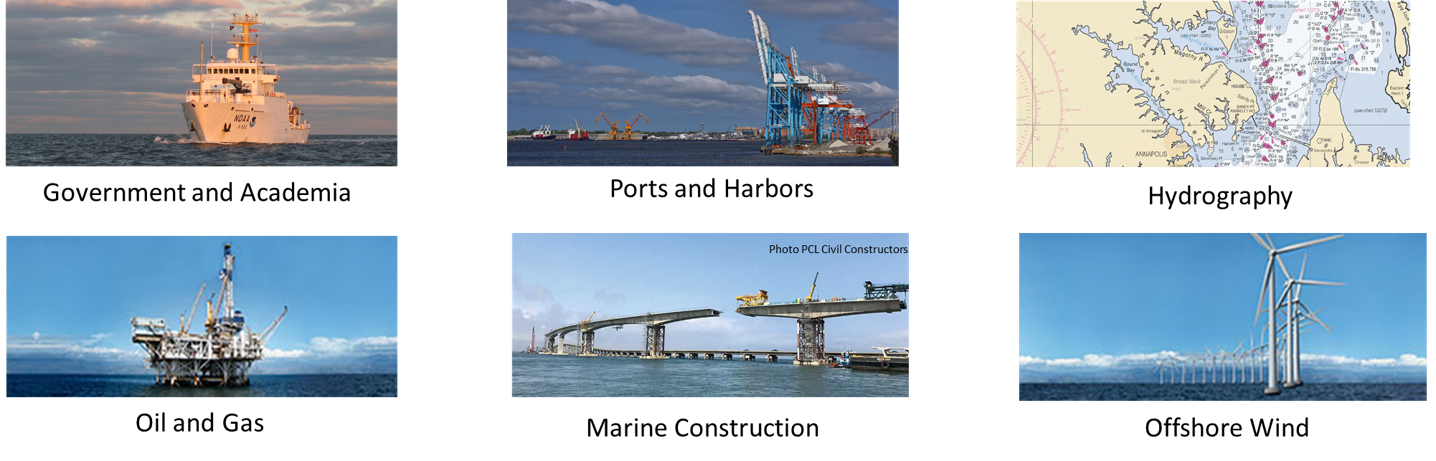
Geopoint has applications across all areas of marine science and infrastructure. From traditional nautical charting to the latest wind energy developments, the cloud architecture provides a ready and scalable on-demand resource. Managing hydrographic data in a cloud environment can improve operations across your organization, small or large.
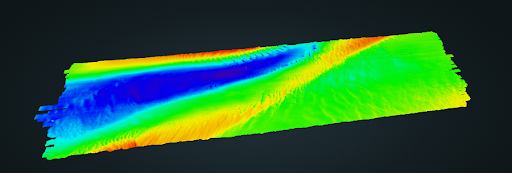
There a many open source options available for point cloud data visualization. The example below shows Geopoint processed xyz data displayed using the Potree 3D web viewer. Raw survey data courtesy of NOAA NCEI.